Computer Vision Autopilot
The computer vision autopilot, like the deep learning autopilot, interprets camera images in order to determine steering and throttle values. However, rather than deep learning models, the computer vision autopilot utilizes traditional computer vision algorithms, such as Canny edge detection, to interpret images of the track. The computer vision autopilot is specifically designed to make it easy to write your own algorithm and use it in place of the built-in algorithm.
The built-in algorithm is a line following algorithm; it expects the track to have a center line, preferably solid, that it can detect. The expected color of the line can be tuned with configuration; by default it expects a yellow line. The algorithm calculates the distance of the line from the center of the image, then a PID controller uses that value to calculate a steering value. If the car is to the left of the line then it will turn right. If the car is to the right of the line then it will turn left. The chosen steering angle is proportional to the distance from the line. The chosen throttle is inversely proportional to the steering angle so that the car will go faster on a straight path and slow down for turns. More details on the algorithm and the configuration parameters are discussed below.
But what if your track does not have a center line; what if it just has a left and right lane boundary lines? What if it is a sidewalk? What if you simply want to implement your own algorithm? The computer vision template is designed to make that pretty easy. You can write your own part in Python to use as the autopilot and simply change the configuration in your myconfig.py to point to it. Your part can utilize computer vision parts in cv.py or you can call OpenCV's python api directly. We present a simplified example below.
IMPORTANT: The computer vision template requires that opencv is installed. Opencv is pre-installed on the Jetson Nano, but it must be explicitly installed on the Raspberry Pi. See Raspberry Pi installation Step 9 and Step 11.
Create a computer vision Application
You can create a computer vision application similarly to the how we create a deep learning application; we just tell it to use the cv_control template instead of the default template. First, make sure your donkeycar python environment is activated, then use the createcar command to create your application folder.
donkey createcar --template=cv_control --path=~/mycar
When updating to a new version of donkeycar, you will want to refresh your application folder. You can do this with the same command, but add --overwrite so that it does not erase your myconfig.py file.
donkey createcar --template=cv_control --path=~/mycar --overwrite
The Line Follower
The built-in algorithm can follow a line using the camera. By default it is tuned for a yellow line, but the color that it tracks can be configured. Many other aspects of the algorithm can be tuned. Below is as description of the algorithm and how it uses the configuraton values. The values themselves are listed and described afterwards.
- If
TARGET_PIXELis None, then use steps 1 to 5 to estimate the target (the expected) position of the line. - Copy the image rows at
SCAN_YandSCAN_HEIGHTpixels height. So the result is a block of pixels as wide as the image andSCAN_HEIGHThigh. - Convert the pixels from
RBGred-gree-blue color space toHSVhue-saturation-value color space. - The algorithm then identifies all the pixels in the block that have an HSV color between
COLOR_THRESHOLD_LOWandCOLOR_THRESHOLD_HIGH. - Once the pixels with the color target are isolated then a histogram is created that creates counts of yellow pixels from left to right for each 1 pixel wide by
SCAN_HEIGHTpixel high slice. - The x value (horizontal offset) of the slice with the most yellow pixels is chosen. This is where the algorithm thinks the yellow line is.
- The difference between this x-value and the
TARGET_PIXELvalue is used as the value the PID algorithm uses to calculate a new steering. If the value is to the left of theTARGET_PIXELmore thanTARGET_THRESHOLDpixels then the car steers right; if hte value is to the right ofTARGET_PIXELmore thanTARGET_THRESHOLDpixels the the car steers left. If the value is withingTARGET_THRESHOLDpixels ofTARGET_PIXELthen steering is not changed. - The steering value is used to decide if the car should speed up or slow down. If steering is not changed then the throttle is increased by
THROTTLE_STEP, but not overTHROTTLE_MAX. If steering is changed then throttle is decreased byTHROTTLE_STEP, but not belowTHROTTLE_MIN.
This pyimagesearch article and accompanying video describe the various color spaces available and OpenCV and their characteristics.
The complete source code is provided and discussed in the LineFollower class section near the end of this page.
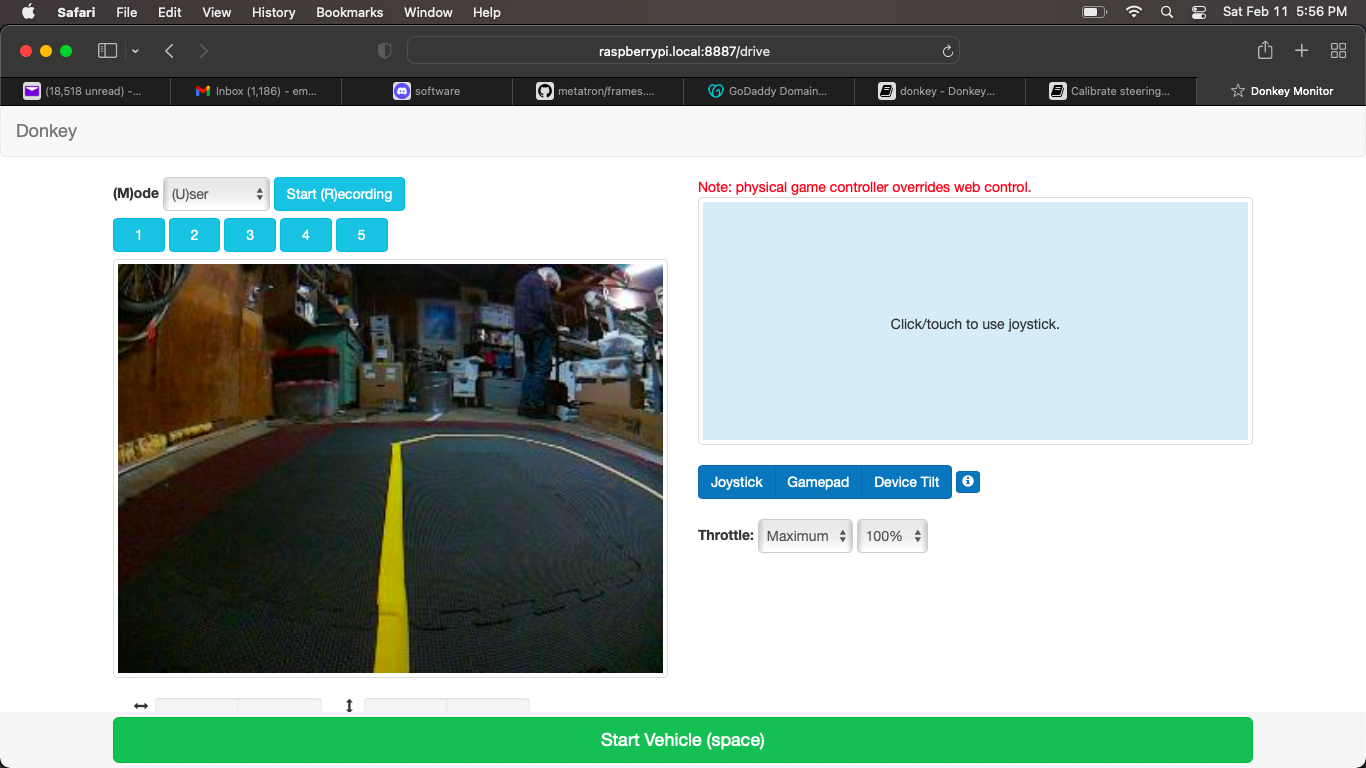
Camera Setup
The image at the top of the page shows the camera setup approximately how it would be using the standard Donkeycar cage. It is angled to see to the horizon so that it can see turns from far away. This is good when going very fast because you can see far ahead. However if the detected line is very thin then it could have artifacting (noise) that could lead to false positives that cause the vehicle to move off the line. If you are not going fast and you want to be as accurate as possible then pointing the camera down at the line is a good idea. So if your camera can be adjusted then you can make trade-offs between accuracy (point it down) and speed (point to to the horizon).
Choosing Parameters for the LineFollower
The computer vision template is a little different than the deep learning and path follow templates; there is no data recording. After setting your configuration parameters you just put your car on the track that has the line that you want to follow and then change from user mode to one of the auto-pilot modes; full-auto or auto-steering. The complete set of configuration parameters can be found in the LineFollower Configuration section below; we will discuss the most important configuration in more detail in this section.
SCAN_Y and SCAN_HEIGHT
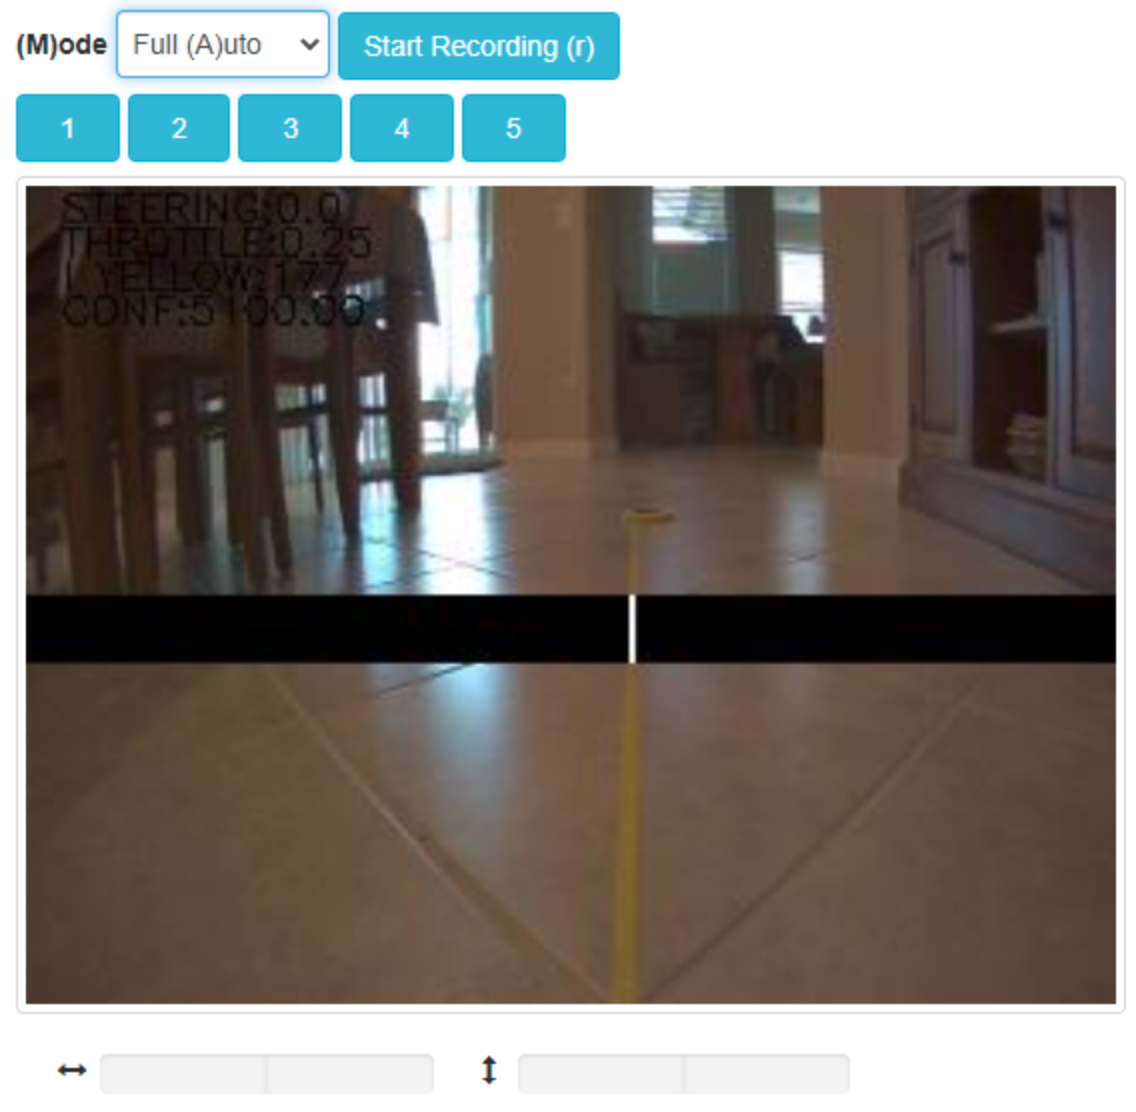
The rectangular area that will be scanned for the line, called the detection area, is determined with the SCAN_Y and SCAN_HEIGHT.
When in autopilot mode, the LineFollower shows the detection area as a horizontal black bar. Pixels that fall within the color threshold range (see next sectino) are drawn as white pixels. Ideally, only the pixels in the line that are in the detection bar will show as white; any white pixels that are NOT part of the line that you want to follow are considered false positives. If the false positives are relatively disperse then they should not interfere with detecting the line. However, if there are big areas of white false positives then they might trick the algorithm. See the next section of how to adjust the color threshold range to minimize false positives.
The image below shows the detection area and the detected line.
COLOR_THRESHOLD_LOW, COLOR_THRESHOLD_HIGH
The color threshold values represent the range of colors used to detect the line; they should be chosen to include the colors in the line in the area that it passes through the detection bar and ideally they should not include any other colors. The color threshold values are in HSV color space (Hue, Saturation, Color) format, not RGB format. RGB color space is how a computer shows colors. HSV color space is closer to how humans perceive color. For our purposes the 'hue' part is the 'pure' color without regard for shadows or lighting. This makes it easier to find a color because it is one number, rather than combination of 3 numbers.
There are many online converters between RGB and HSV. This one was used when creating this documentation; peko-step I like that tool because it will allow the Saturation and Value to be output in the range of 0.255, which is what we need. IMPORTANT: The online tools use the standard way of representing HSV, which is a Hue value of 0 to 359 degrees, Saturation of 0 to 100%, Value of 0 to 100%. OpenCV, which our code is based on, uses a Hue value of 0 to 179, Saturation of 0 to 255 and value of 0 to 255; so be aware that you may need to convert from the tool's values to the OpenCV values when changing these configurations.
When choosing the threshold colors it is important to take into account what the camera will see including the lighting conditions. Donkeycar includes a script to make this easy to do. the hsv_picker.sh script allows you to view the live camera image or alternatively to choose a static image to view. So if you are running a desktop image on your car (so not a server image or headless image) then you can run the script and view the camera image. If you do not have a desktop on the car, then you can run the car and open the web view in a browser on your host laptop at take a screen shot to save it, then use that static image with the hsv_picker.sh script on your laptop computer. In either case, arrange the car on the course so it can see the line as it would see it when you drive in autopilot so you are getting a realistic view.
You can run the hsv_picker.sh script to view a screen shot image; with the donkey python environment activated run the script from the root of your donkeycar repo folder;
python scripts/hsv_picker.sh --file=<path-to-image>
To view the camera stream, again with donkey python environment activated, run the script from the root of your donkeycar repo folder;
python scripts/hsv_picker.sh
If you have more than one camera and it is not showing the correct one, you can choose the camera index and/or set the image size
python scripts/hsv_picker.sh --camera=2 --width=320 --height=240
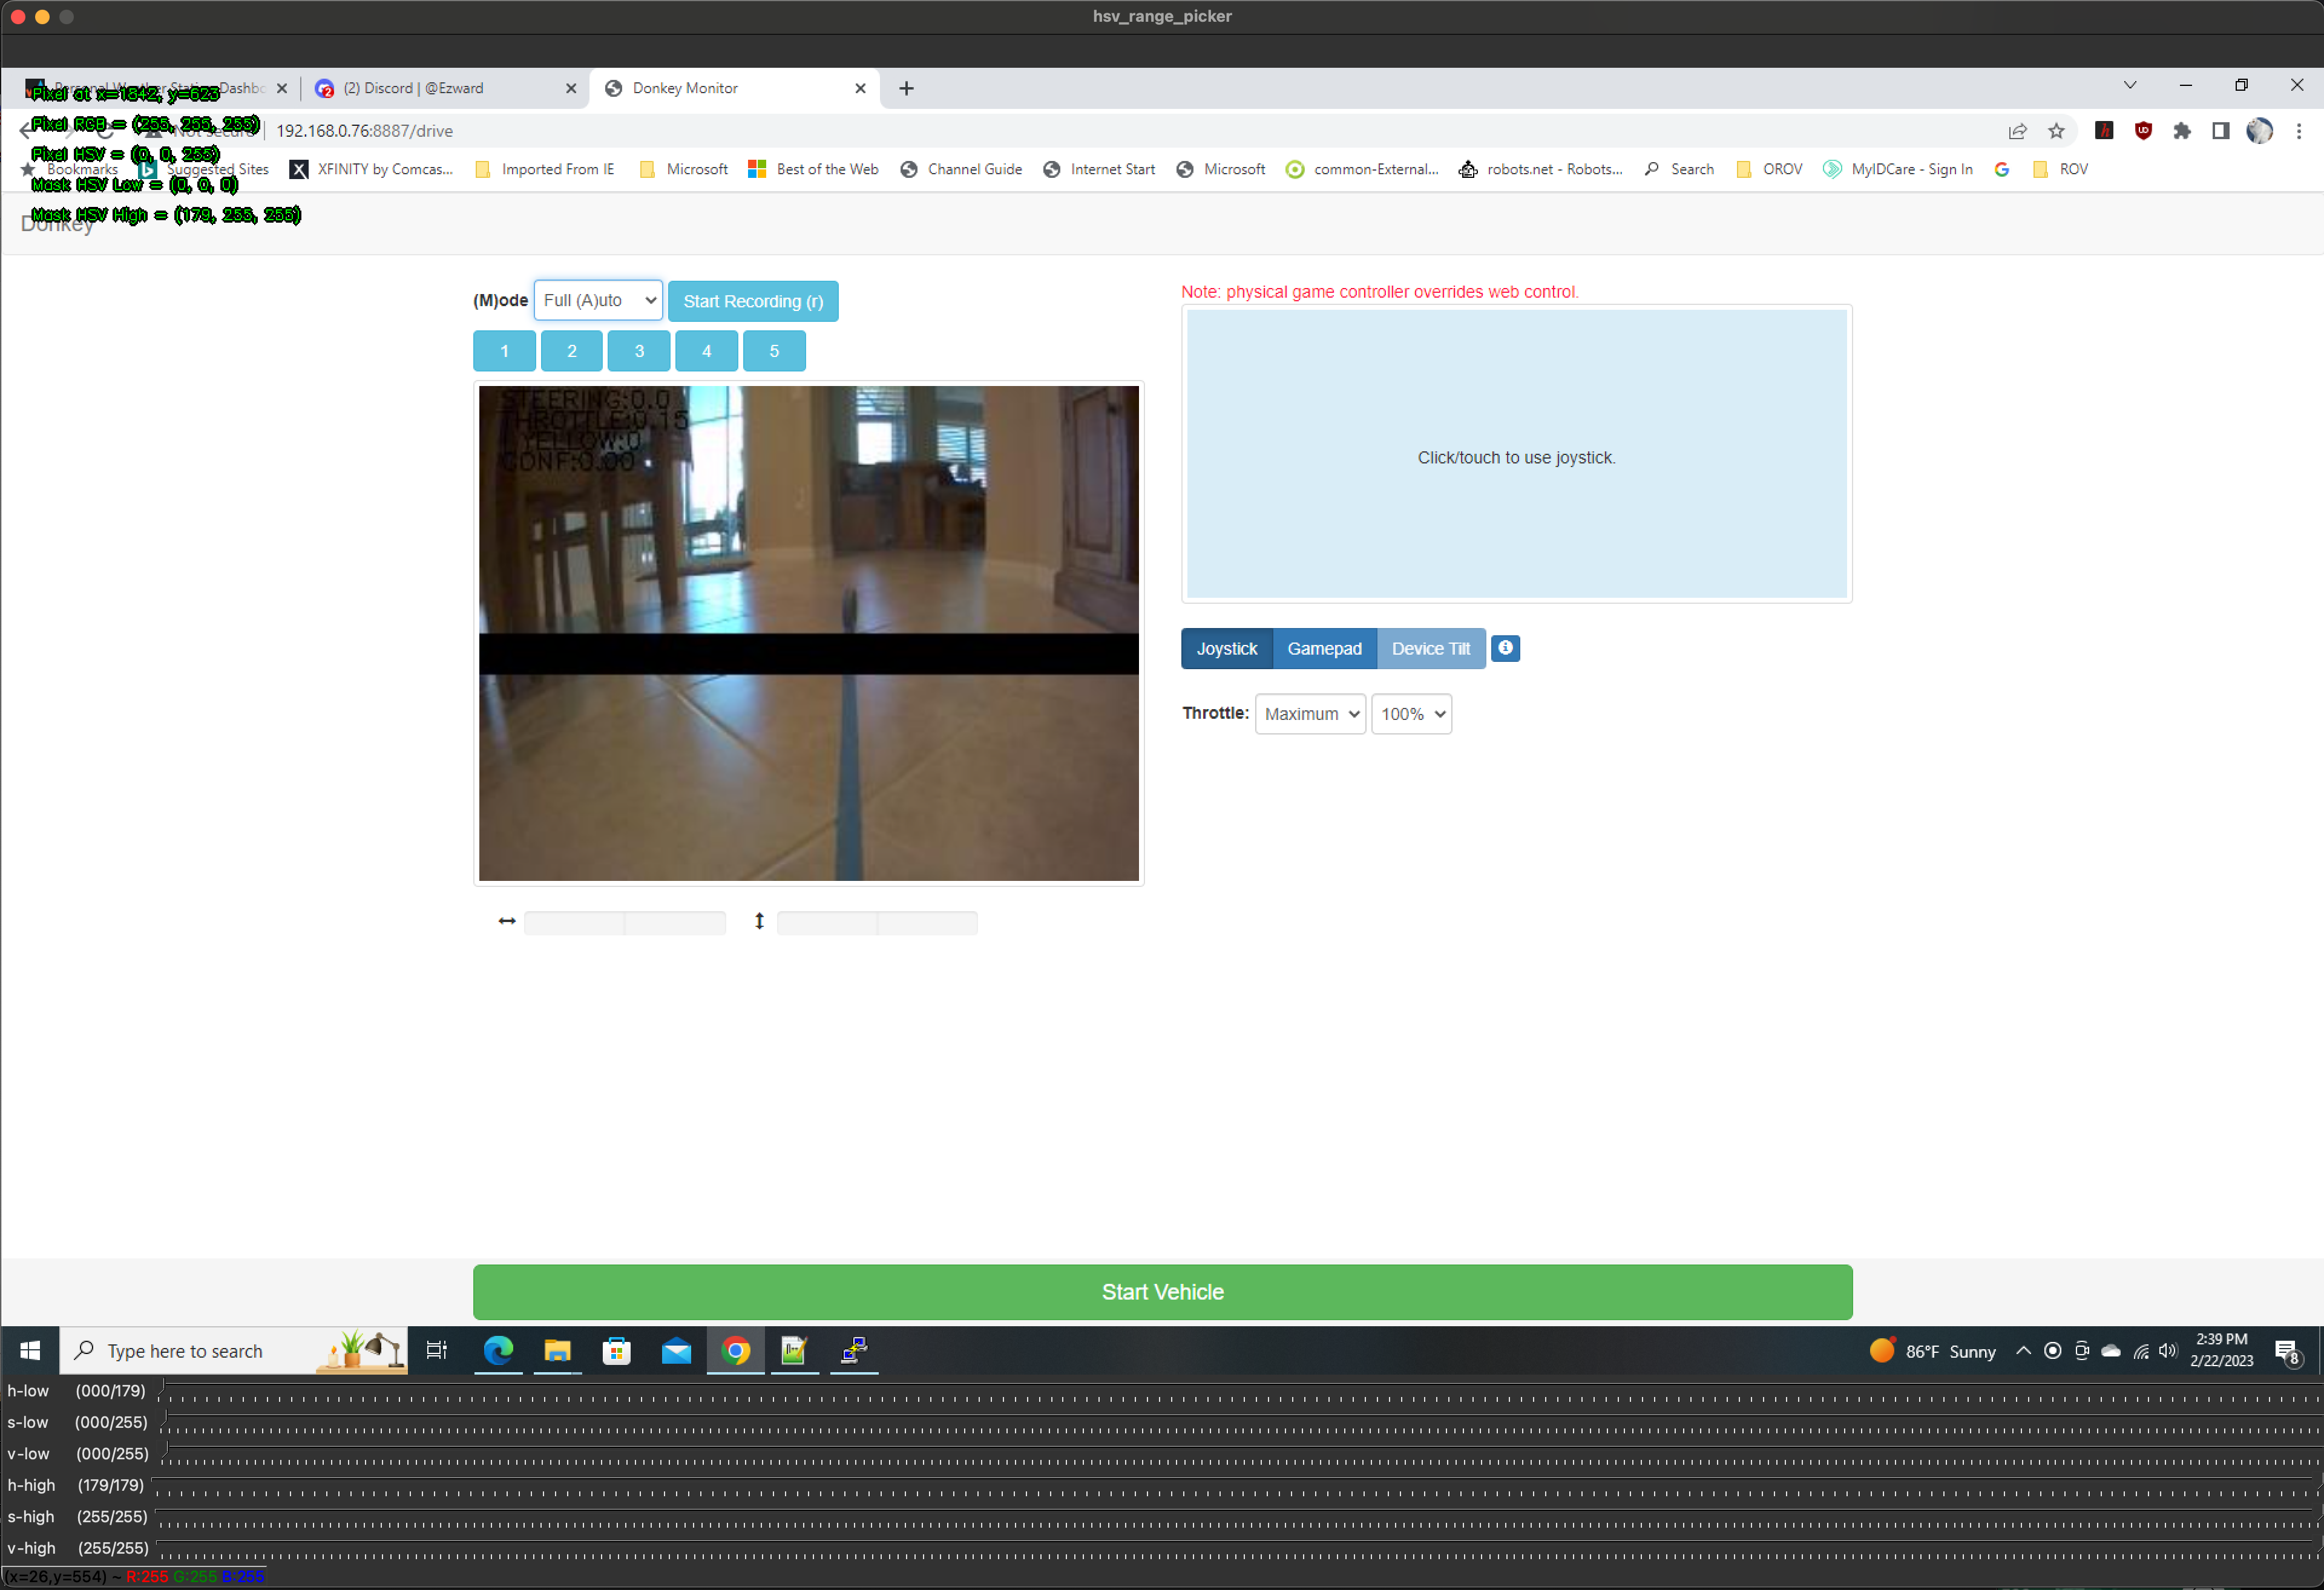
The image above shows the hsv_script.sh with a web ui screenshot loaded. The blue line in the center of the image is the line that we want to follow. The horizontal black bar in the camera image is the detection bar; this is defined by SCAN_Y and SCAN_HEIGHT and is the area where the mask is applied to try to isolate the pixels in the line. When pixels are detected they will be draw in white in the detection area.
The bottom of the screen has 6 trackbars to select the 3 parts of the low HSV value and the 3 parts of the high HSV value that are used to create a mask to pull out the pixels in the line. You can move those scrollbars manually to try to find the best values for the detection range. As you change the scrollbars the resulting mask will be applied to the image and you will see pixels start to turn back. The Hue value is typically the most important value. You can reset the trackbars and clear the mask anytime by selecting the Escape key on the keyboard.
Using the scrollbars works, but there is an easier way. You can also just select a rectangular area by clicking-dragging-releasing; the pixels in that area will be searched for a low and high value and the trackbars will by updated with those low and high values. So the easiest way to find the mask for the line is to select a rectangular area on the line itself. You can fine-tune the selected mask using the trackbars.
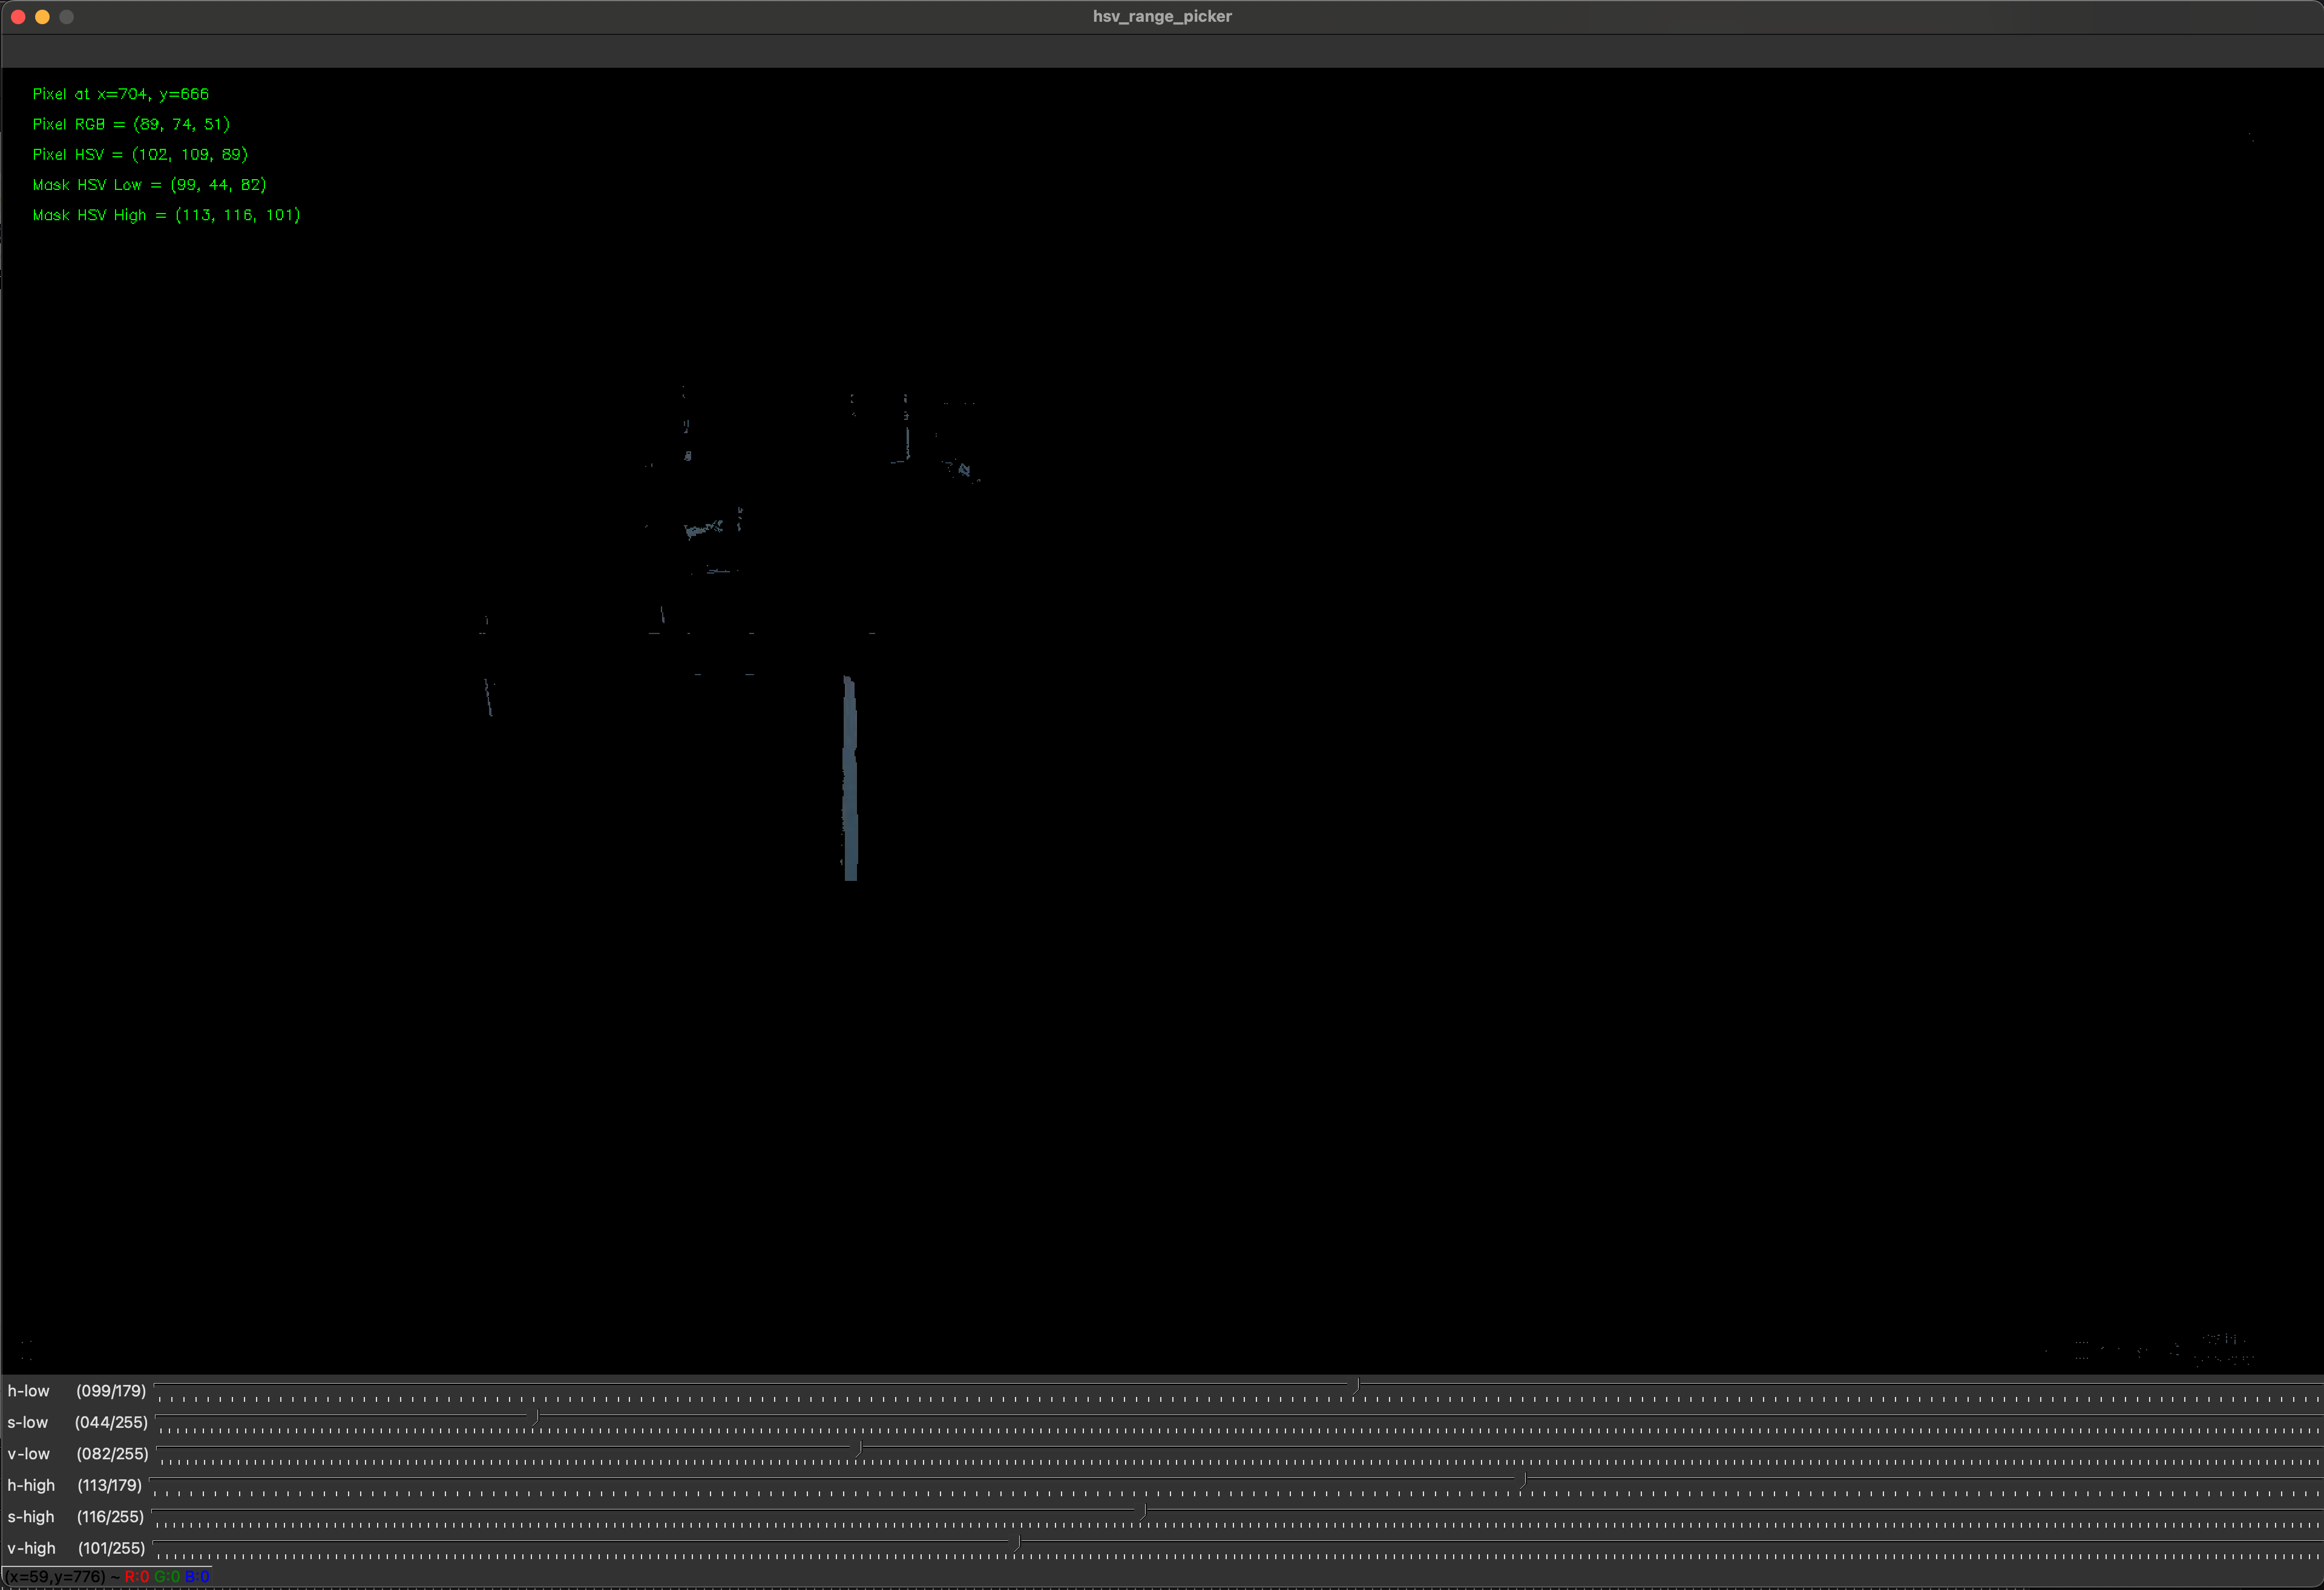
The image below shows the mask that was created by selecting a rectangular area within the blue line.
Features of hsv_picker.sh:
- change the low and high mask values using the taskbars at the bottom of the screen.
- set the low and high mask values by selecting a rectangular area on the image using click-drag-release.
- select the Escape key on the keyboard to clear the mast.
- select the 'p' key to print the current mask values to the console.
- select the 'q' key to print the final mask values and quit.
TARGET_PIXEL
The TARGET_PIXEL value is the expected horizontal position of the line to follow in the image. The line follow algorithm will adjust steering to try to keep the line at that position in the image. More specifically, the difference between the TARGET_PIXEL value and where the line follow algorithm detects that actual line is in the image is used by a PID controller to adjust steering (see The PID Controller) below.
If you are the only car on the course, then you probably want the car to drive directly on the line to follow. In this case setting TARGET_PIXEL to the horizontal center of the image at (IMAGE_W / 2) means the auto-pilot assumes the line to follow should be directly in the middle of the image and so the car will try to stay in the middle. So if your car actually starts to the left or right of that line, it will quickly move the the line and stay on it.
However, if you are on a course where two cars drive at the same time (there are two lanes separated by a line), then you probably want your car to stay in it's lane. In that case you would set TARGET_PIXEL to None, which will cause the car to detect the location of the line at startup. The auto-pilot will then assume the line should stay at that position in the image, and so it will the try to keep the car it it's lane to make that true.
If you are really motivated then you might try implementing a lane-changing algorithm that would dynamically change the target pixel value in order to move from one lane to another.
LineFollower Configuration
The complete set of configuration values and their defaults can be found in donkeycar/templates/cfg_cv_control.py and is copied here for convenience.
# configure which part is used as the autopilot - change to use your own autopilot
CV_CONTROLLER_MODULE = "donkeycar.parts.line_follower"
CV_CONTROLLER_CLASS = "LineFollower"
CV_CONTROLLER_INPUTS = ['cam/image_array']
CV_CONTROLLER_OUTPUTS = ['pilot/steering', 'pilot/throttle', 'cv/image_array']
CV_CONTROLLER_CONDITION = "run_pilot"

# LineFollower - line color and detection area
SCAN_Y = 120          # num pixels from the top to start horiz scan
SCAN_HEIGHT = 20      # num pixels high to grab from horiz scan
COLOR_THRESHOLD_LOW  = (0, 50, 50)    # HSV dark yellow (opencv HSV hue value is 0..179, saturation and value are both 0..255)
COLOR_THRESHOLD_HIGH = (50, 255, 255) # HSV light yellow (opencv HSV hue value is 0..179, saturation and value are both 0..255)

# LineFollower - target (expected) line position and detection thresholds
TARGET_PIXEL = None   # In not None, then this is the expected horizontal position in pixels of the yellow line.
                      # If None, then detect the position yellow line at startup;
                      # so this assumes you have positioned the car prior to starting.
TARGET_THRESHOLD = 10 # number of pixels from TARGET_PIXEL that vehicle must be pointing
                      # before a steering change will be made; this prevents algorithm
                      # from being too twitchy when it is on or near the line.
CONFIDENCE_THRESHOLD = (1 / IMAGE_W) / 3  # The fraction of total sampled pixels that must be yellow in the sample slice.
                                          # The sample slice will have SCAN_HEIGHT pixels and the total number
                                          # of sampled pixels is IMAGE_W x SCAN_HEIGHT, so if you want to make sure
                                          # that all the pixels in the sample slice are yellow, then the confidence
                                          # threshold should be SCAN_HEIGHT / (IMAGE_W x SCAN_HEIGHT) or (1 / IMAGE_W).
                                          # If you keep getting `No line detected` logs in the console then you
                                          # may want to lower the threshold.

# LineFollower - throttle step controller; increase throttle on straights, descrease on turns
THROTTLE_MAX = 0.3    # maximum throttle value the controller will produce
THROTTLE_MIN = 0.15   # minimum throttle value the controller will produce
THROTTLE_INITIAL = THROTTLE_MIN  # initial throttle value
THROTTLE_STEP = 0.05  # how much to change throttle when off the line

# These three PID constants are crucial to the way the car drives. If you are tuning them
# start by setting the others zero and focus on first Kp, then Kd, and then Ki.
PID_P = -0.01         # proportional mult for PID path follower
PID_I = 0.000         # integral mult for PID path follower
PID_D = -0.0001       # differential mult for PID path follower

OVERLAY_IMAGE = True  # True to draw computer vision overlay on camera image in web ui
                      # NOTE: this does not affect what is saved to the data
The PID Controller
It is very common to use a Proportional Integral Derivative (PID) controller to control throttle and/or steering in a wheeled robot. For example, the Path Follow autopilot uses a PID algorithm to modify steering based on how far away from the desired path the robot is. In the Computer Vision template, the built-in Line Follower algorithm uses a PID in a similar way; the line follow algorithm outputs a value that is proportional to how far the car is from the center line and whose sign indicates which side of the line it is on. The PID controller uses the magnitude and sign of the distance from the center line to calculate a steering value that will move the car towards the center line.
The path_follow autopilot also uses a PID controller. There is a good description of how to tune a controller for driving at Determining PID Coefficients
Writing a Computer Vision Autopilot
You can use the CV_CONTROLLER_* configuration values to point to a python file and class that implements your own computer vision autopilot part. Your autopilot class must conform to the donkeycar part standard. You can also determine the name of the input values, output values and run_condition. The default configuration values point the the included LineFollower part. At a minimum computer vistion autpilot part takes the camera image as an input and outputs the autopilot's throttle and steering values.
Let's create a simple custom computer vision part. It won't be much of an autopilot because it will just output a constant throttle and steering value and an image that counts that frames.
A computer vision is a donkeycar part, so at a minimum it must be a Python class with a run(self) method. An autpilot needs a little more than that, which we will see, but here is a minimal structure;
import cv2
import numpy as np
from simple_pid import PID
import logging

logger = logging.getLogger(__name__)


class MockCvPilot:
    def __init__(self, pid, cfg):
        # initialize instance properties
        pass

    def run(self, img):
        # use img to determine a steering and throttle value
        return 0, 0, None  # steering, throttle, image
The constructor, __init__(self, pid, cfg) takes a PID controller instance and the vehicle configuration properties. It is very common for autopilots to use a PID controller, so the framework provides one. Your autopilot may have values that you want to adjust to tune the algorithm; you should put those values in the myconfig.py configuration file, then retrieve them in the constructor. In our MockCvPilot we want to know if the user wants to see the telemetry image or just the camera image. We do the same thing in the built-in LineFollower autopilot part, so we can just re-use that configuration value, OVERLAY_IMAGE, in our autpilot. We can add that in our constructor;
    def __init__(self, pid, cfg):
        self.pid_st = pid
        self.overlay_image = cfg.OVERLAY_IMAGE
        self.counter = 0
The run(self, img) method is called each time through the loop. This is where you will interpret the image that is passed and determine a steering and throttle value that the car should use. The Computer Vision template also allows for showing an image in the web ui that is different in autopilot mode; typically you would add telemetry information to the camera image that is passed to run; such as the new steering and throttle values and perhaps a other alterations to the image so the user can better understand how the algorithm is working. For instance, if your algorithm did edge detection using the Canny algorithm, then you might want to show the processed image with the edges. So the minimal autopilot part returns a tuple of (steering, throttle, image).
To keep things simple, the MockCvPilot won't actually predict a steering and throttle, it will just return zero for each. However it will maintain a counter and display that in the telemetry image. We can see that in the run() method.
    def run(self, cam_img):
        if cam_img is None:
            return 0, 0, None

        self.counter += 1

        # show some diagnostics
        if self.overlay_image:
            # draw onto a COPY of the image so we don't alter the original
            cam_img = self.overlay_display(np.copy(cam_img))

        return self.steering, self.throttle, cam_img
There are a couple of things to note here:
- The
run()method is protected against an empty camera image - this can happen, espcially during startup. So in this case we stop the car. - We only produce a telemetry image if the original configuration value,
OVERLAY_IMAGE, that we copied intoself.overlay_imageisTrue. If it is notTruethen we just pass throught the original camera image. - Note that we make a copy of the original camera image so that we do not alter the original. This is called a defensive copy; we don't know what other parts in the vehicle need to do with the orignal image, so we don't want t alter it.
We put the logic that draws the telemetry image into it's own method so keep the both it and the run() method clean and cohesive. Also because we run() method has made a defensive copy of the original image, the method can do anything it wants to the image; even overwrite it completely. In our case we just draw some text on it to show the steering, throttle and counter values. We know the steering and throttle values will be zero in our mock autopilot, but it is instructive to show how you might display them. In this case we are showing them as text, but you might prefer to show them as bars, like we do in the webui, or some other visualization. This is the display method we use in our mock autopilot;
    def overlay_display(self, img):
        display_str = []
        display_str.append(f"STEERING:{self.steering:.1f}")
        display_str.append(f"THROTTLE:{self.throttle:.2f}")
        display_str.append(f"COUNTER:{self.counter}")

        lineheight = 25
        y = lineheight
        x = lineheight
        for s in display_str:
            cv2.putText(img, s, color=(0, 0, 0), org=(x ,y), fontFace=cv2.FONT_HERSHEY_SIMPLEX, fontScale=1, thickness=3)
            cv2.putText(img, s, color=(0, 255, 0), org=(x ,y), fontFace=cv2.FONT_HERSHEY_SIMPLEX, fontScale=1, thickness=1)
            y += lineheight

        return img
There are a couple of things to note: - We organize the text as an array of strings; that makes it easy to process the line when we are drawing the text. You might even want to have a separate method to create this list of text string and possibly pass them into the display() methed if that simplies the display method or makes it more versatile (it can do both). - We draw the text twice, once with a thick black stroke and then again with a thinner green stroke. This creates green text with a black outline; this makes it easier to read on an unpredictable background.
Here is the complete custom computer vision autopilot part:
import cv2
import numpy as np
from simple_pid import PID
import logging

logger = logging.getLogger(__name__)


class MockCvPilot:
    '''
    OpenCV based MOCK controller; just draws a counter and
    returns 0 for thottle and steering.

    :param pid: a PID controller that can be used to estimate steering and/or throttle
    :param cfg: the vehicle configuration properties
    '''
    def __init__(self, pid, cfg):
        self.pid_st = pid
        self.overlay_image = cfg.OVERLAY_IMAGE
        self.steering = 0
        self.throttle = 0
        self.counter = 0


    def run(self, cam_img):
        '''
        main runloop of the CV controller.

        :param cam_img: the camerate image, an RGB numpy array
        :return: tuple of steering, throttle, and the telemetry image.

        If overlay_image is True, then the output image
        includes an overlay that shows how the
        algorithm is working; otherwise the image
        is just passed-through untouched.
        '''
        if cam_img is None:
            return 0, 0, None

        self.counter += 1

        # show some diagnostics
        if self.overlay_image:
            # draw onto a COPY of the image so we don't alter the original
            cam_img = self.overlay_display(np.copy(cam_img))

        return self.steering, self.throttle, cam_img

    def overlay_display(self, img):
        '''
        draw on top the given image.
        show some values we are using for control

        :param img: the image to draw on as a numpy array
        :return: the image with overlay drawn
        '''
        # some text to show on the overlay
        display_str = []
        display_str.append(f"STEERING:{self.steering:.1f}")
        display_str.append(f"THROTTLE:{self.throttle:.2f}")
        display_str.append(f"COUNTER:{self.counter}")

        lineheight = 25
        y = lineheight
        x = lineheight
        for s in display_str:
            # green text with black outline so it shows up on any background
            cv2.putText(img, s, color=(0, 0, 0), org=(x ,y), fontFace=cv2.FONT_HERSHEY_SIMPLEX, fontScale=1, thickness=3)
            cv2.putText(img, s, color=(0, 255, 0), org=(x ,y), fontFace=cv2.FONT_HERSHEY_SIMPLEX, fontScale=1, thickness=1)
            y += lineheight

        return img
To use the custom part, we must modify the myconfig.py file in the mycar folder to locate the python file and the class within it and to specify the inputs, outputs and run_condition that should be used when adding the part to the vehicle loop:
# # configure which part is used as the autopilot - change to use your own autopilot
CV_CONTROLLER_MODULE = "my_cv_pilot"
CV_CONTROLLER_CLASS = "MockCvPilot"
CV_CONTROLLER_INPUTS = ['cam/image_array']
CV_CONTROLLER_OUTPUTS = ['pilot/steering', 'pilot/throttle', 'cv/image_array']
CV_CONTROLLER_CONDITION = "run_pilot"
CV_CONTROLLER_MODULE is the package path to the my_cv_autpilot.py file. It is generally is convenient to have this in the mycar folder and this is what we have done here. However, if you are developing this in your own repository, then if you are a Mac or Linux machine you can create a symbolic link to the file or the folder in which the file or files are.
CV_CONTROLLER_CLASS is the name of the part's class in the python file to which CV_CONTROLLER_MODULE points. In our case this is MockCvPilot.
CV_CONTROLLER_INPUTS is an array of the named inputs to the part that are passed when the part is added to the vehicle loop. For a computer vision autopilot the image is the minimum required. However you can pass any named values in the vehicle's memory. These correspond in a one-to-one fashion to the arguments (ignore the self argument) to the autopilot's run() method. So our mock example expects only an image run(self, cam_img) and we only declare an image in the inputs, ['cam/image_array'].
CV_CONTROLLER_OUTPUTS is an array of named outputs to the part that are passed when the part is added to vehicle loop. These correspond to the return values from the autopilot's run(). This is an autopilot, so we return a steering value and a throttle value. We also produce a new image with telemetry information drawn on it. So our mock autopilot returns return self.steering, self.throttle, cam_img which corresponds to the declared output values, ['pilot/steering', 'pilot/throttle', 'cv/image_array'].
CV_CONTROLLER_CONDITION is the named value that decides if the autopilot part will run or not run. If you always want it to run, then pass None, otherwise this should be the name of a boolean value; when it is True the part's run() method will be called; when it if False the run() method is not called. The templates maintain such a boolean value named "run_pilot", so we use that.
LineFollower Class
Now that you understand the structure of an autopilot part, it is worth reviewing the pseudocode in The Line Follower section above and compare that to the actual implementation. The python file is located at https://github.com/autorope/donkeycar/blob/main/donkeycar/parts/line_follower.py and is copied below. In particular:
- get_i_color() uses SCAN_Y and SCAN_HEIGHT to copy a section of the camera image, convert it to HSV and apply the mask created by the low and high HSV mask values. Then it finds the x (horizontal) index in the area that has the highest amount of the positive pixels; that is where the autopilot thinks the line is.
    def get_i_color(self, cam_img):
        # take a horizontal slice of the image
        iSlice = self.scan_y
        scan_line = cam_img[iSlice : iSlice + self.scan_height, :, :]

        # convert to HSV color space
        img_hsv = cv2.cvtColor(scan_line, cv2.COLOR_RGB2HSV)

        # make a mask of the colors in our range we are looking for
        mask = cv2.inRange(img_hsv, self.color_thr_low, self.color_thr_hi)

        # which index of the range has the highest amount of yellow?
        hist = np.sum(mask, axis=0)
        max_yellow = np.argmax(hist)

        return max_yellow, hist[max_yellow], mask
- Note how target value is initialized by reading the image if it is not already initialized in the configuration:
        max_yellow, confidence, mask = self.get_i_color(cam_img)
        if self.target_pixel is None:
            self.target_pixel = max_yellow
- Note how the PID controller's set point (the target value) in initialized in the
run()method with theTARGET_PIXELvalue.
        if self.pid_st.setpoint != self.target_pixel:
            # this is the target of our steering PID controller
            self.pid_st.setpoint = self.target_pixel
- If we got a good reading from the image, then we use it to predict a new steering value based on the horizontal distance of the detected line from the target_pixel.
        if confidence >= self.confidence_threshold:
            # invoke the controller with the current yellow line position
            # get the new steering value as it chases the ideal target_value
            self.steering = self.pid_st(max_yellow)
- Slow down if we are turning
            if abs(max_yellow - self.target_pixel) > self.target_threshold:
                # we will be turning, so slow down
                if self.throttle > self.throttle_min:
                    self.throttle -= self.delta_th
- Or speed up if we are going straight
            else:
                # we are going straight, so speed up
                if self.throttle < self.throttle_max:
                    self.throttle += self.delta_th
Here is the complete source to the LineFollower part.
import cv2
import numpy as np
from simple_pid import PID
import logging

logger = logging.getLogger(__name__)


class LineFollower:
    '''
    OpenCV based controller
    This controller takes a horizontal slice of the image at a set Y coordinate.
    Then it converts to HSV and does a color thresh hold to find the yellow pixels.
    It does a histogram to find the pixel of maximum yellow. Then is uses that iPxel
    to guid a PID controller which seeks to maintain the max yellow at the same point
    in the image.
    '''
    def __init__(self, pid, cfg):
        self.overlay_image = cfg.OVERLAY_IMAGE
        self.scan_y = cfg.SCAN_Y   # num pixels from the top to start horiz scan
        self.scan_height = cfg.SCAN_HEIGHT  # num pixels high to grab from horiz scan
        self.color_thr_low = np.asarray(cfg.COLOR_THRESHOLD_LOW)  # hsv dark yellow
        self.color_thr_hi = np.asarray(cfg.COLOR_THRESHOLD_HIGH)  # hsv light yellow
        self.target_pixel = cfg.TARGET_PIXEL  # of the N slots above, which is the ideal relationship target
        self.target_threshold = cfg.TARGET_THRESHOLD # minimum distance from target_pixel before a steering change is made.
        self.confidence_threshold = cfg.CONFIDENCE_THRESHOLD  # percentage of yellow pixels that must be in target_pixel slice
        self.steering = 0.0 # from -1 to 1
        self.throttle = cfg.THROTTLE_INITIAL # from -1 to 1
        self.delta_th = cfg.THROTTLE_STEP  # how much to change throttle when off
        self.throttle_max = cfg.THROTTLE_MAX
        self.throttle_min = cfg.THROTTLE_MIN

        self.pid_st = pid


    def get_i_color(self, cam_img):
        '''
        get the horizontal index of the color at the given slice of the image
        input: cam_image, an RGB numpy array
        output: index of max color, value of cumulative color at that index, and mask of pixels in range
        '''
        # take a horizontal slice of the image
        iSlice = self.scan_y
        scan_line = cam_img[iSlice : iSlice + self.scan_height, :, :]

        # convert to HSV color space
        img_hsv = cv2.cvtColor(scan_line, cv2.COLOR_RGB2HSV)

        # make a mask of the colors in our range we are looking for
        mask = cv2.inRange(img_hsv, self.color_thr_low, self.color_thr_hi)

        # which index of the range has the highest amount of yellow?
        hist = np.sum(mask, axis=0)
        max_yellow = np.argmax(hist)

        return max_yellow, hist[max_yellow], mask


    def run(self, cam_img):
        '''
        main runloop of the CV controller
        input: cam_image, an RGB numpy array
        output: steering, throttle, and the image.
        If overlay_image is True, then the output image
        includes and overlay that shows how the
        algorithm is working; otherwise the image
        is just passed-through untouched.
        '''
        if cam_img is None:
            return 0, 0, False, None

        max_yellow, confidence, mask = self.get_i_color(cam_img)
        conf_thresh = 0.001

        if self.target_pixel is None:
            # Use the first run of get_i_color to set our relationship with the yellow line.
            # You could optionally init the target_pixel with the desired value.
            self.target_pixel = max_yellow
            logger.info(f"Automatically chosen line position = {self.target_pixel}")

        if self.pid_st.setpoint != self.target_pixel:
            # this is the target of our steering PID controller
            self.pid_st.setpoint = self.target_pixel

        if confidence >= self.confidence_threshold:
            # invoke the controller with the current yellow line position
            # get the new steering value as it chases the ideal target_value
            self.steering = self.pid_st(max_yellow)

            # slow down linearly when away from ideal, and speed up when close
            if abs(max_yellow - self.target_pixel) > self.target_threshold:
                # we will be turning, so slow down
                if self.throttle > self.throttle_min:
                    self.throttle -= self.delta_th
                if self.throttle < self.throttle_min:
                    self.throttle = self.throttle_min
            else:
                # we are going straight, so speed up
                if self.throttle < self.throttle_max:
                    self.throttle += self.delta_th
                if self.throttle > self.throttle_max:
                    self.throttle = self.throttle_max
        else:
            logger.info(f"No line detected: confidence {confidence} < {self.confidence_threshold}")

        # show some diagnostics
        if self.overlay_image:
            cam_img = self.overlay_display(cam_img, mask, max_yellow, confidence)

        return self.steering, self.throttle, cam_img

    def overlay_display(self, cam_img, mask, max_yellow, confidense):
        '''
        composite mask on top the original image.
        show some values we are using for control
        '''

        mask_exp = np.stack((mask, ) * 3, axis=-1)
        iSlice = self.scan_y
        img = np.copy(cam_img)
        img[iSlice : iSlice + self.scan_height, :, :] = mask_exp
        # img = cv2.cvtColor(img, cv2.COLOR_RGB2BGR)

        display_str = []
        display_str.append("STEERING:{:.1f}".format(self.steering))
        display_str.append("THROTTLE:{:.2f}".format(self.throttle))
        display_str.append("I YELLOW:{:d}".format(max_yellow))
        display_str.append("CONF:{:.2f}".format(confidense))

        y = 10
        x = 10

        for s in display_str:
            cv2.putText(img, s, color=(0, 0, 0), org=(x ,y), fontFace=cv2.FONT_HERSHEY_SIMPLEX, fontScale=0.4)
            y += 10

        return img